In an effort to measure the impact of COVID-19, a number of experts are turning to a measure called excessive deaths.
Excessive deaths occur when deaths during a current time period are greater than what would be expected based on an average of deaths over a previous time period.
The measure of excess deaths does not depend on identifying the cause of death, it simply reveals that deaths occurred. This approach gets past the controversy of assigning a cause and focuses on deaths related to past expectations.
For example, the CDC reported that in New York City during March 11–May 2, 2020, a total of 32,107 deaths were reported. Of these deaths, 24,172 were found to be in excess of the seasonal expected baseline.
Is there evidence of excessive deaths in Florida?
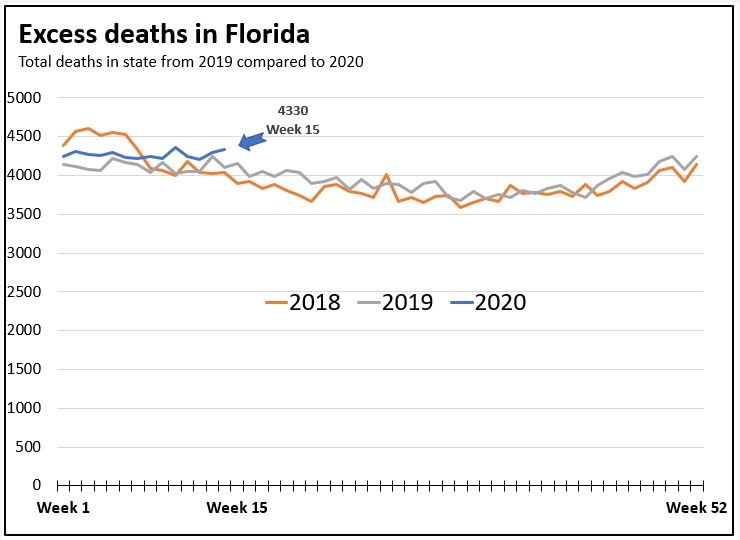
The chart below shows weekly deaths in Florida for 2018, 2019 and for the first 15 weeks of 2020 (week ending April 11, 2020). The source of the data is the CDC.
In week 15, which is highlighted below, there were 4,330 deaths reported. During the same week in 2018 there were 3,896 deaths and in 2019 there were 4,153 deaths.
Looking at cumulative deaths through week 15, there were 63,825 in 2018, 61,756 in 2019, and 64,092 in 2020.
Based on the cumulative numbers, excessive deaths in 2020 could be estimated to be 1-3%.

What about another state?
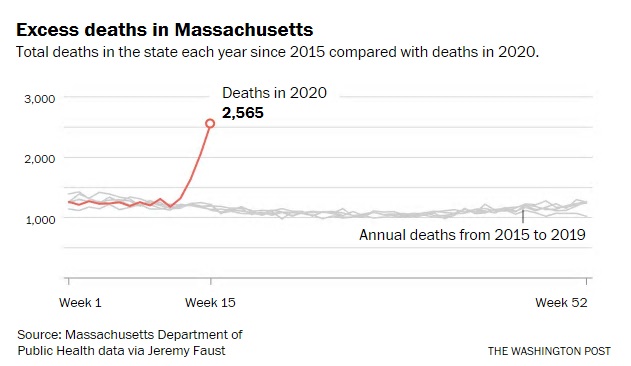
Provided below is a graph that shows the weekly deaths from 2015 to 2019 in Massachusetts compared to 2020. The graph shows that excessive deaths – as defined by the 2015-2019 trends – are being surpassed during weeks 13-15.
During week 15, excess deaths are a over 100% of what was to be expected.

The Massachusetts experience is comparable to other states in the Northeast. What is happening in Florida, related to excessive deaths, is comparable to the situation in Georgia. These numbers explain, in part, why Georgia and Florida are further along in re-opening their economies.
TR will update the data as the CDC processes more information on fatalities.


When will this chart be updated? Come on it’s almost December and this ends in April.
When do you expect to have updated figures for excessive deaths in Florida for May-July?
1) Good question. Florida has fairly quick reporting, so the lag for FL should be closer to 1 week than 8.
2) None of these graphs are using averages.
3) Also a good question. If you overlay the reported Covid-death numbers, you’ll see they “cover” the excess deaths from 2019. That’s consistent with Covid being the principal difference. It’s unclear whether stay-home orders are net negative or positive on overall death. There’s lots of depression and stress going on.
Good question. Looks like population growth is around 1-2% annually in Florida, at present. Of course, the people that move here aren’t “average”, so we don’t know if they’re more or less likely to die that same year. Presumably there’s a lag. In any case, population growth should account for no more than about 2% of the increase over 2019. But that would affect the 2020 graph uniformly. We’re interested in a Covid-related deviation, which is distinguishable in the data and graph.
How is this statistic impacted by:
1) the 1-8 week lag in reporting and recording all deaths (according to CDC website)
2) using beginning-of-year statistics to calculate average (virus started for real in March)
3) reduction in deaths by other causes due to stay-at-home policies (fewer accidents, etc.)
https://www.cdc.gov/nchs/nvss/vsrr/covid19/index.htm
Even though Excessive Deaths are minimal in Florida, how much further is that impacted by population growth?
Absolutely This. 900+ people per day move to Florida, or 330,605 per year.
Talking more locally, does TR have the transmission aka reproductive rate of the virus for Leon and surrounding counties since a lot of citizens commute back and forth?