

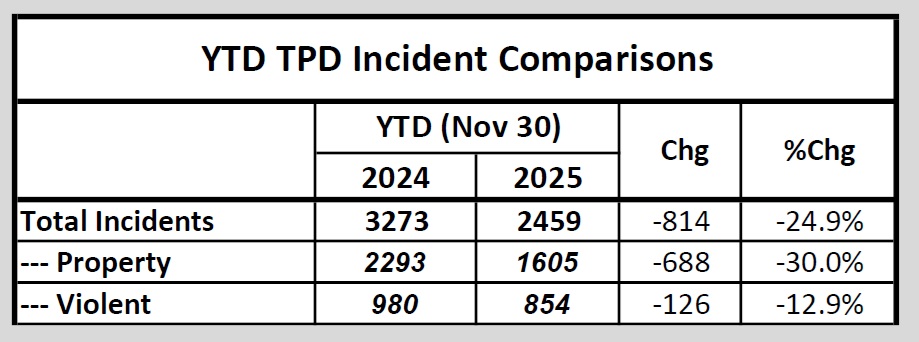
Through November, crime incident data published daily by the Tallahassee Police Department shows that total crime incidents have declined by 24.9% when compared to incident data from January thru November in 2024. The drop was driven by a 42.9% decline in commercial burglaries and a 31.5% decline auto related crime incidents.
Despite the year-to-date declines, over the last three months violent crime incidents related to assaults are up 48% when compared to the same three-month period in 2024. During this period in 2024 there were 155 reported assaults, compared to 230 assaults in 2025.
The YTD Numbers
The incident data -tabulated by TR – show that property crime incidents are down 30.0% and violent crime incidents are down 12.8% during the 11-month period.
Property crimes encompass burglaries, thefts, and incidents of vandalism. Violent incidents include aggravated assaults, armed robberies, and physical altercations.
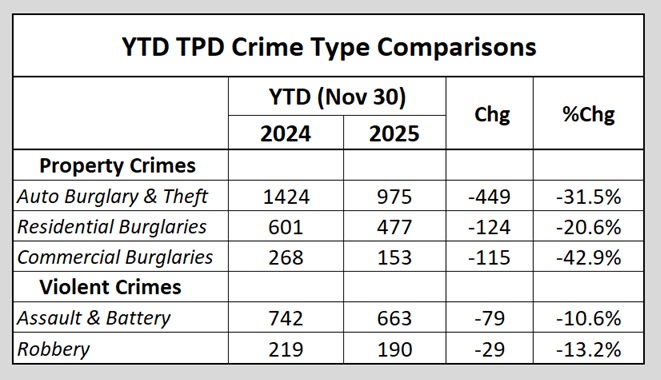
A look at specific crimes (see table below) reveals the decrease in property crime was driven by a 42.9% decrease in commercial burglaries and a 3.15% decrease the Auto Burglary & Theft category – which accounts for approximately 55% of all property crime.
The violent crime data shows that robbery incidents were down 13.2% while assault & battery incidents were down 10.6%.
Fatal Shootings
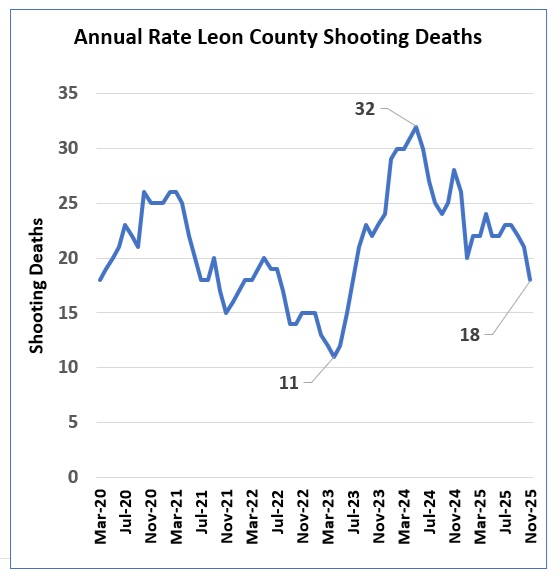
During this 11-month period, there have been 18 fatal shootings in 2025, compared to 26 fatal shooting deaths in 2024. The annual rate of shooting deaths has been trending down since May 2024 when the number of deaths reached 32.
Violent Crime Continues to Increase, YTD Incidents Still Down added by Staff on
View all posts by Staff →
Shootings being such a small amount of violence, this shows the real problem is ALL violence, regardless of the tool. But we know what most violence is over, drugs or domestic. In certain areas. We are just afraid to focus on that.
@ Steve & Staff
Article states: “During this 11-month period, there have been 18 fatal shootings in 2025, compared to 26 fatal shooting deaths in 2024.”
The graph indicates this data is an annual number. If so, the annual total would start each year at zero. As more people are shot and killed, it would add to the YTD total and simply be a line on an upward slope for each year.
The graph with this article shows about 23 people shot dead YTD by the July-25 time-frame but only 18 by Nov-25. Did some of these people come back to life?
You may want to review exactly what this data represents.
Some law enforcement in our community are not truly being allowed to do the job they need or want to do. Too much money and effort being put into positions and programs that really do not address the crime in our community. Our law enforcement should be law enforcement and not as concerned with providing social services. Some law enforcement in our community is top heavy. Too many “chiefs”, not enough “Indians”. Very understaffed at the important areas.
For the slow learners in the group, break down the crime statistics by race. Or maybe include a few Tim Tok videos of the EBT/SNAP crowd complaining about the government shutdown. It will narrow down exactly where the problem is.