

Provided below are two charts addressing the daily number of COVID cases reported in Leon County and the daily testing positivity rate.
Based on information provided by Leon County government, both of these metrics are determining factors in evaluating how the virus is spreading in the community and a factor in when the mask mandate might be lifted.
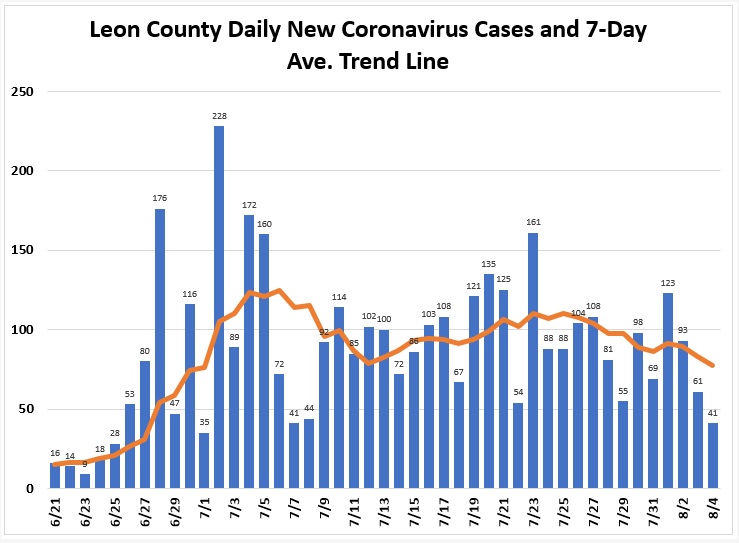
The chart below shows the daily positive cases (blue) and a 7-day average trend line (yellow). After a 10-14 day increase in cases from June 23rd to July 5th, the trend line shows a decline from July 5th to July 12th. Since July 12th, growth in news cases have remained relatively flat. The average number of daily cases during this time has been approximately 95.
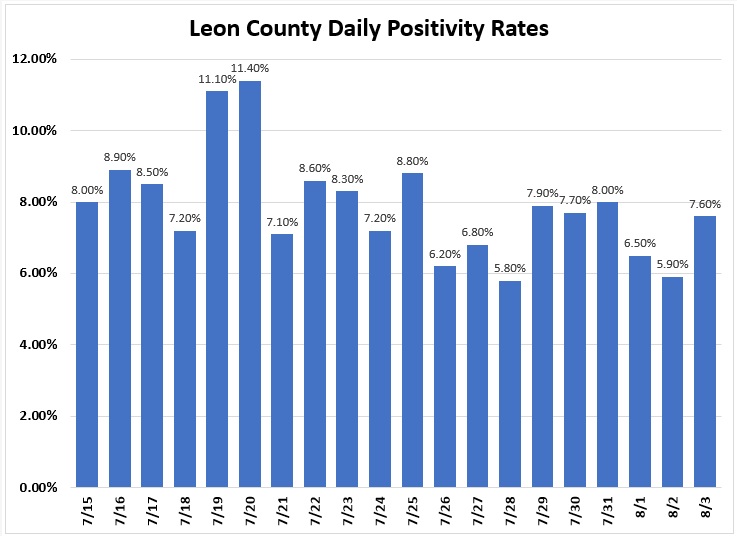
The chart below shows the daily positive COID-19 test rate for Leon County from July 15th through August 3rd. Since July 20th, the positivity rate has been trending down but has remained consistently above 5%.
Growth in New Leon COVID Cases Flatten, Positivity Rate Still Above 5% added by Staff on
View all posts by Staff →
500,000 have tested positive in Florida. That means 2 million Floridians have NOT identified as positive.
Note – Leon county mask ordinance passed on 6/25, with no particular beneficial effect.