
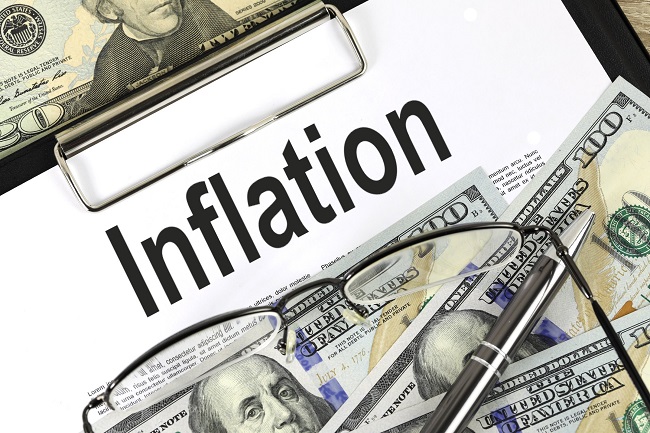
On Tuesday morning, the U.S. Bureau of Labor Statistics released the latest information on inflation.
The report notes that the all items index continued to accelerate, rising 8.5 percent for the 12 months ending March, the largest 12-month increase since the period ending December 1981.
The all items less food and energy index rose 6.5 percent, the largest 12-month change since the period ending August 1982. The energy index rose 32.0 percent over the last year, and the food index increased 8.8 percent, the largest 12-month increase since the period ending May 1981.
“The big news in the March report was that core price pressures finally appear to be moderating,” wrote Andrew Hunter, senior U.S. economist at Capital Economics. Hunter said he thinks the March increase will “mark the peak” for inflation as year-over-year comparisons drive the numbers lower and energy prices subside.
Due to the surge in inflation, real earnings, despite rising 5.6% from a year ago, still weren’t keeping pace with the cost of living. Real average hourly earnings posted a seasonally adjusted 0.8% decline for the month, according to a separate Bureau of Labor Statistics report.
The Labor Department report shows that Consumer Price Index for All Urban Consumers (CPI-U) increased 1.2 percent in March on a seasonally adjusted basis after rising 0.8 percent in February.
Increases in the indexes for gasoline, shelter, and food were the largest contributors to the seasonally adjusted all items increase. The gasoline index rose 18.3 percent in March and accounted for over half of the all items monthly increase; other energy component indexes also increased.
Food rose 1% for the month and 8.8% over the year, as prices for goods such as rice, ground beef, citrus fruits and fresh vegetables all posted gains of more than 2% in March. Energy prices were up 11% and 32% respectively as gasoline prices popped 18.3% for the month, boosted by the war in Ukraine and the pressure it is exerting on supply.

What cost $1.00 in 1913, now costs the "little people" $29.29... as the federal government mal-spending, over-spending, crony socialism, currency debasing & price inflation roar on and on.
Cheapo ground beef that cost $1 in 1970, $1.29 in 1984, now costs about $4.76 (oops, gotta update that graph).
Natural gas was $0.304 per therm in 1978 (after the roaring inflation & stagflation of Nixon & Carter was under way), now $1.411. Electricity was $0.046 per KWh in 1978, now $0.15 per KWh... with government dictated monopolies right along (with a dozen or so cities with competing electricity generators back then, and a few with competition in distribution, notably Lubbock, TX). Overall energy index was 21.3 in 1957, now 298.246 (ditto on the bureaucratic obscurantism).
Gasoline? Fuggedaboudit. The bureau of labor statistics & census bureau can't read the spinning needles on the meters.
Housing was 30.5 in 1967, now 293.577 (ditto).
Transportation was 14.2 in 1935, 22.5 in 1950, about 30 in 1960, 36.5 in 1970, 77.7 in 1980, 117.2 in 1990, 148.3 in 2000, 190.5 in 2010, now 264.525 (ditto).
Education, info & communication was 84.3 in 1993, now about 143.475 (base 1997 Dec=100).
One of their food & beverages indexes was 34.8 in early 1967, now 294.064 (they based it on an impossible to untangle amalgam of 1982-1984 prices).
They stopped tracking & reporting peanut butter prices a couple years ago, red delicious apples... claiming no one was interested in those prices.
14.5% when Carter left office.