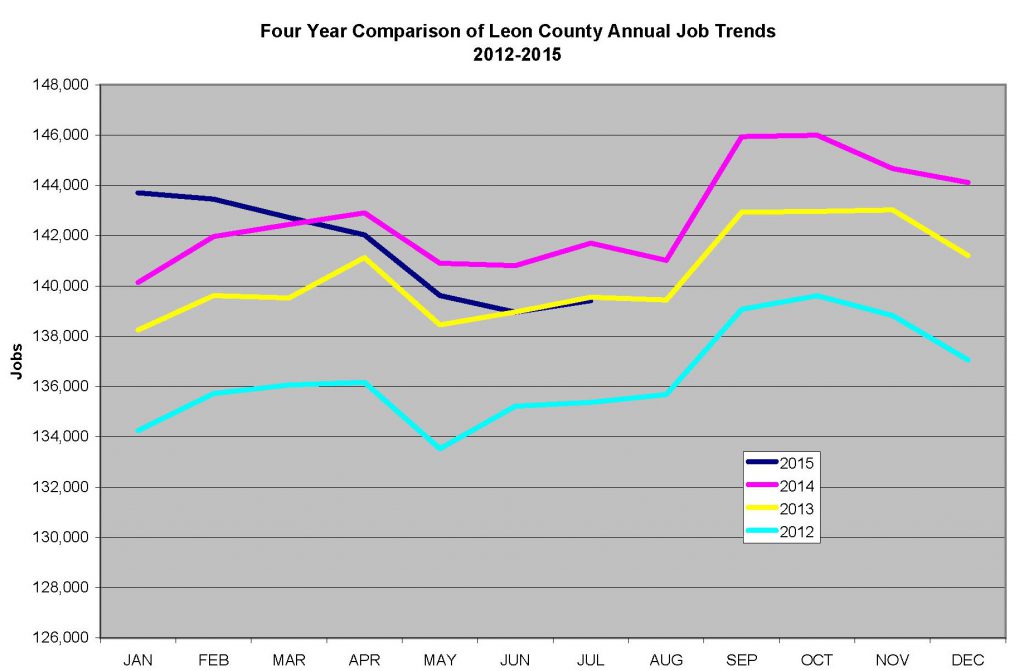
Our recent reports on Leon county employment numbers have shown a dramatic decrease in jobs this year. The disturbing trend can be seen in the chart below.
We have had a number of readers ask about the cyclical nature of the Leon county job market.
More specifically, we have had readers ask if the decline in employment in 2015 is consistent with the yearly cyclical trends evident over the last few years.
TR decided to take a look.
The chart below shows a the graph of Leon county employment for the last three years ( 2012-light blue, 2013-yellow, & 2014-pink) and the first seven months of 2015 (dark blue). The cyclical trends are quite obvious from 2012-2014.
The cyclical trend can be described as adding jobs in first part of the year, February through April, losing jobs from May through July and adding jobs again from August through October.
However, while the February to April time shows job growth in 2012, 2013, & 2014, no such trend is evident in 2015.
In fact, during 2015, when jobs should have been added, based on past years, thousands of jobs were lost. 
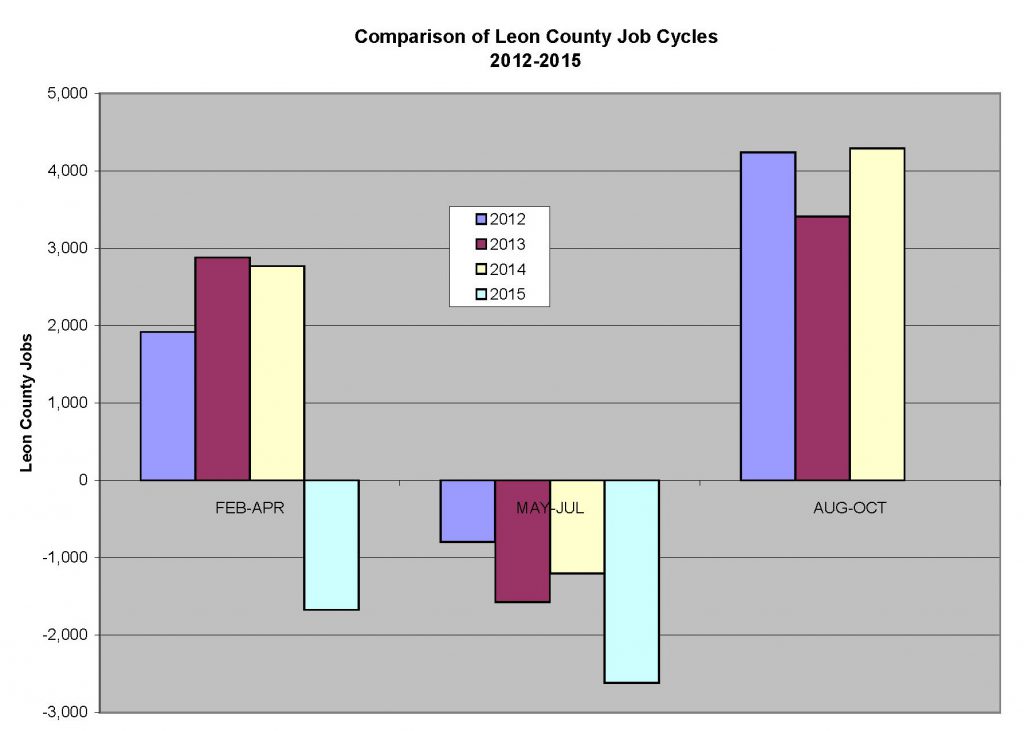
The bar graph below shows how “out of cycle” the significant loss of jobs in Leon county was during the first of this year, from February to April.
The previous three years added over 1,800 jobs during this period, while during 2015, Leon county lost almost 2,000 jobs.
The graph above shows that 2015 has been consistent with the downward trend from May through July evident in prior years.
However, the bar graph below shows that during 2015, Leon county has lost significantly more jobs than any of the previous three years during the “down” period from May through July.
During this period, Leon county lost approximately 2,500 jobs.

So what about the next five months of 2015?
Based on the cyclical trends, Leon county has added a significant amount of jobs from the August through October time period.
Also, based on the previous three years, Leon county has ended the year with approximately 3,500 more jobs that it started with over the last three years.
Will this happen again this year?
To finish up 2015 with 3,500 more jobs than was reported in January of 2015, Leon county would have to add approximately 7,000 jobs during the “up-cycle” period from August to October.
The bar graph above shows that adding 7,000 jobs during this “up-cycle” period is significantly more than has been added during this period over the last three years.
Tallahassee Reports will publish the next employment report near the end of this month.


How to stop the economic development wars
This article illustrates the folly of governments competing with each other in the formerly free market to see who can give away the most tax dollars for so-called economic development. I disagree that the solution is more government- another federal law. In Florida, this giveaway is generally prohibited by Article 7 Sec. 10 of the state constitution, yet legislators have made an end-run via chapter 125 of the statutes and local politicians are of the mindset “If we don’t spend it, someone else will.” Since Florida’s Constitution contains no supremacy clause, a lawsuit would need to be filed to determine the validity of either the constitution or statute. Lawsuits cost money, and those that truly support limited government don’t have any.
Economic incentives need to promises for either money or tax breaks – IF the company meets promised new jobs, not money up front.
According to the Department of Management Services, Leon County state government employment over the past few years was (as of June 30):
2014 – 19,442
2013 – 19,322
2012 – 19,562
2011 – 20,355
I would like to see these numbers and trends compared with the shrinkage in, and the downsizing of, Federal, State and local governments.
It might also benefit us to see the correlation (if any) between lowering trends, salaries, and the skilled labor pool. Do we have the local talent we need to attract the jobs we want? What can the community do to improve adult retraining, or re-education? Are we losing jobs to those areas already established, with higher salaries attracting talent AWAY from our community?
Another question is how many tax dollars have been spent upon “economic development” and promised jobs- which never materialized? One indicator of economic development is the local sales tax revenue as published by the Dept. of Revenue on form 3 (link for verification is below).
According to these state government records, Leon County brought in $47.1 million in FY 2015 (July 2014-June 2015). In FY 2014, the non-adjusted amount was $49.5 million, which when adjusted for inflation is actually $49.9 million. That’s $2.8 million less coming in. FY 2013 was $47.4M non-adjusted or $48.5M adjusted. Not being the product of a common-core education, I realize the county is bringing in less revenue than it did for the last 2 years.
DOR Local Government Tax Receipts by County (Form 3) link
But what do I know? I’m just one of those looking for the vanishing jobs and apparently not qualified to get one.